Learn how to model motion using linear regression on position–time data.
Watch the Khan Academy video "Estimating Line of Best Fit".
With the data already shown on the graph, drag a movable line until it best matches
the overall trend of the points. This will be your estimated line of best fit before running the regression.
Visit the Getting Started page and prepare your workspace.
Roll your Observe™ LEGO Car on your desk, collect position–time data in Desmos, and generate a linear regression model.
Use your regression equation to make a prediction about the car’s motion. Record your results in the Activity 5 online worksheet.
Getting Ready:
Linear regression is a method for finding a line that best represents a set of data points.
The line shows the overall trend, even
if the data is a little scattered.
The slope of the line tells you the
average speed and direction.
The y-intercept shows the estimated
starting position at time = 0.
You will use regression in this activity to create a model of your
car’s motion and then use it to make predictions.
To learn more about interpreting graphs, watch this Khan Academy
video:
×
Click this
review of
position–time graph concepts to check your understanding.
What Do You Think?
Open the
LEGO Car Activity 5 Worksheet
in a new tab of your browser. Make a copy in your Google Drive, then return to this page.
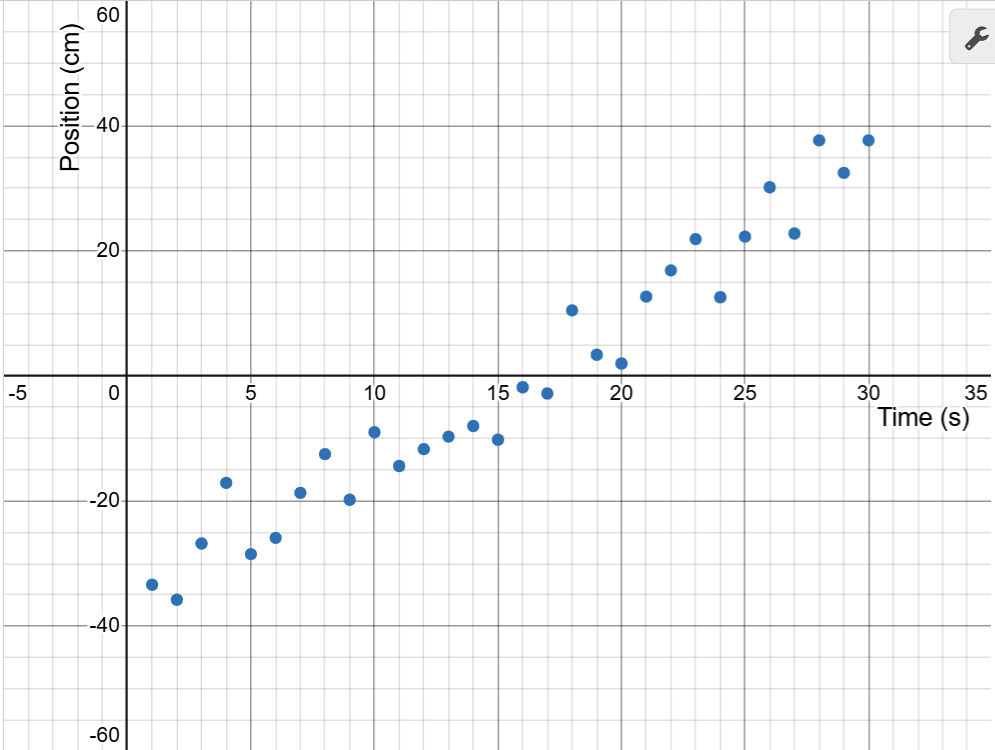
Look at the scatter plot of position–time data already displayed on the graph.
Drag the endpoints of the red movable line until it best follows the overall trend of the points.
Your line should start near -30 cm at time = 0 and be close to 40 cm at 30 s.
When you are satisfied with your estimated line of best fit, click
Capture Drawing to copy the image to the clipboard and paste it into the Activity 5 worksheet.
Measuring Your Data:
Review the Getting Started guide to set up your workspace and pair your LEGO car.
When the graph loads, use the m1 and b1 sliders to create a prediction line.
Adjust the slope (m) to set the car’s speed and direction.
Adjust the y-intercept (b) to set the car’s starting position.
This is your blue goal line.
Scroll until the entire graph is visible. Notice that the car’s position (the red point) updates on the graph’s y-axis.
Smoothly roll your car back and forth on the number line until the red point matches your starting position.
To begin collecting measurements in your Desmos data table, click the Start Collection button below.
Your real data will begin to appear as blue points, and a regression line will be generated to model the data.
Compare your goal line (based on sliders) with the regression model line.
How close is your prediction?
Where do they differ?
If you need a new trial, click the Refresh Page button to clear the graph and data. Then turn on your car,
select the ID from the pulldown, and reconnect.
Use your regression equation to make predictions. Record the predicted position of the car at
10 seconds and 20 seconds, and compare with the actual data points from your graph.
When finished, click the Capture Graph button to copy your graph to the clipboard. Select the browser tab
with the Activity 5 worksheet and paste it into your document.
Use the hide and show icon to hide the completed graph and show the next challenge.