Learn that the y-intercept on a graph shows the starting position
of your LEGO car when time = 0.
Watch the Khan Academy video "Intercepts Introduction"
to review what intercepts mean on a graph.
Read a short description of how your LEGO car will move, then sketch your
prediction of its position–time graph.
Go to the Getting Started page and set up your workspace so you’re ready to collect data.
Roll your Observe™ LEGO Car on your desk and watch it send position–time points
to Desmos in real time. Match the motion to several graph challenges.
For each challenge, write a clear description of the car’s motion in the
Activity 2 online worksheet.
Getting Ready:
Graphs help us visualize data. The horizontal x-axis and vertical y-axis
represent two different measurements. In these activities, time in seconds
will be on the x-axis, and position will be on the y-axis.
A linear function, y = mx + b, can be used to model the LEGO car’s motion data.
The y-intercept, b, shows the car’s position when time = 0.
The y-intercept is not where the car stops—it is where the car starts.
Even if the line slopes upward or downward, the intercept shows the
initial position before any motion happens.
The y-intercept can be positive, negative, or zero.
A positive y-intercept means the car starts to the right of zero.
A negative y-intercept means the car starts to the left of zero.
A zero y-intercept means it starts exactly at the reference point.
To learn more about interpreting graphs, watch this Khan Academy video:
×
Click this review of
position–time graph concepts to check your understanding.
What Do You Think?
Open the
LEGO Car Activity 2 Worksheet
in a new tab of your browser. Make a copy in your Google Drive, then return to this page.
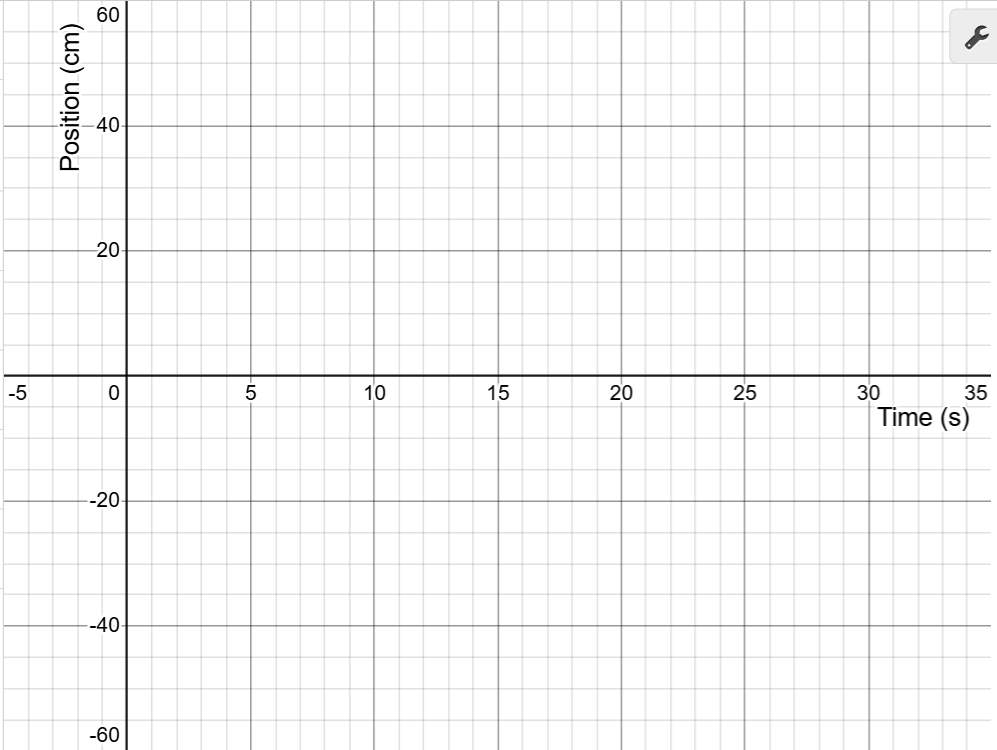
On the graph below, sketch your prediction of the LEGO car’s position–time graph.
The car begins with a y-intercept at –30 cm (its starting position) and
stays there, not moving, for 30 seconds.
Use your mouse to click and drag on the graph to draw your prediction.
If you need to start over, click Erase Drawing.
When you’re satisfied, click Capture Drawing to copy the image
to the clipboard and paste it into the Activity 2 worksheet.
Measuring Your Data:
Review the Getting Started guide to set up your workspace and pair your LEGO car.
Scroll until the entire graph is visible. Watch the car’s position (the red point) on the y-axis at time = 0.
Smoothly roll your car along the number line until the red point matches the graph’s initial position (the y-intercept) on the y-axis.
This sets your starting position for matching the graph.
Click Start Collection to begin recording points in the Desmos data table.
Roll the car smoothly to match the red data point to the blue position–time graph shown in Desmos.
Keep movements steady to reduce noise in the data.
Repeat until you are satisfied with the match. Click Refresh Page to clear the graph and data.
Turn on your car, select its ID from the dropdown, and reconnect.
When finished, click Capture Graph to copy your matched graph to the clipboard. Switch to the Activity 2 worksheet tab and paste the image.
Use the hide/show icon in Desmos to hide your completed graph and reveal the next challenge.